Numerator: Consumer good prices stay volatile with April increase

A slight dip in consumer the cost of consumer goods in March 2026 did not carry into April.
Prices for everyday household purchases rose 0.49% month over month in April 2026, following a one-month decrease of 0.02% in March 2026. This pattern continued volatility in consumer good prices seen at the beginning of the year, with a 0.19% increase in February and a 0.33% decrease in January.
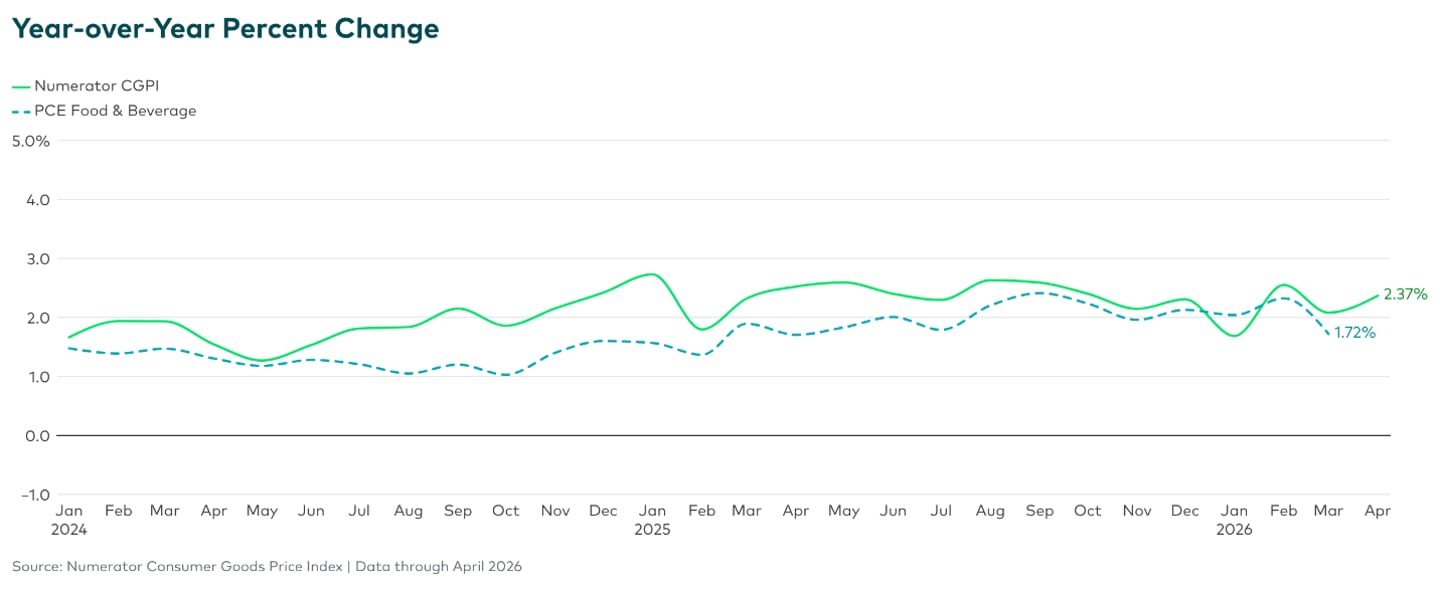
The monthly Numerator Consumer Goods Price Index (CGPI) also indicates that prices for everyday goods are up 2.4% compared to April 2025. A similar trend is expected for the comparable categories covered in the Bureau of Labor Statistics’ upcoming Consumer Price Index (CPI) release.
“April’s data underscores how uneven the path back to price stability continues to be,” said Paul Stanley, senior economist, Numerator. “Following a brief pause in March, inflation for everyday consumer goods picked up again in April, signaling that underlying cost pressures remain persistent. Ongoing tensions with Iran introduce additional uncertainty, as sustained disruption to key supply chains could contribute to further upward pressure on prices. This comes at a challenging time for consumers, as higher gas prices are already creating headwinds for household budgets, particularly among lower-income households.”
[READ MORE: Consumer sentiment hits record low amid fears over Iran war impact]
Additional key findings from the Numerator April CGPI include:
- Annual inflation edged up in April after a cooler March.
- Low income and Gen Z consumers continue to experience higher levels of inflation for everyday household goods as prices have increased 34.3% and 38.4% respectively for those groups since January 2018, compared to the 32.2% national average.
- Regionally, consumers in the South census region have also experienced higher levels of inflation since 2018.
The Numerator CGPI is calculated from verified, item-level transactions provided by a panel of 200,000 geographically and demographically representative U.S. households. These data include purchases across categories such as grocery, household goods, and health and beauty. Values are aggregated monthly to produce index levels and month-over-month and year-over-year percent changes, providing a current view of inflation trends. The dataset uses verified household purchase data from the demand side.