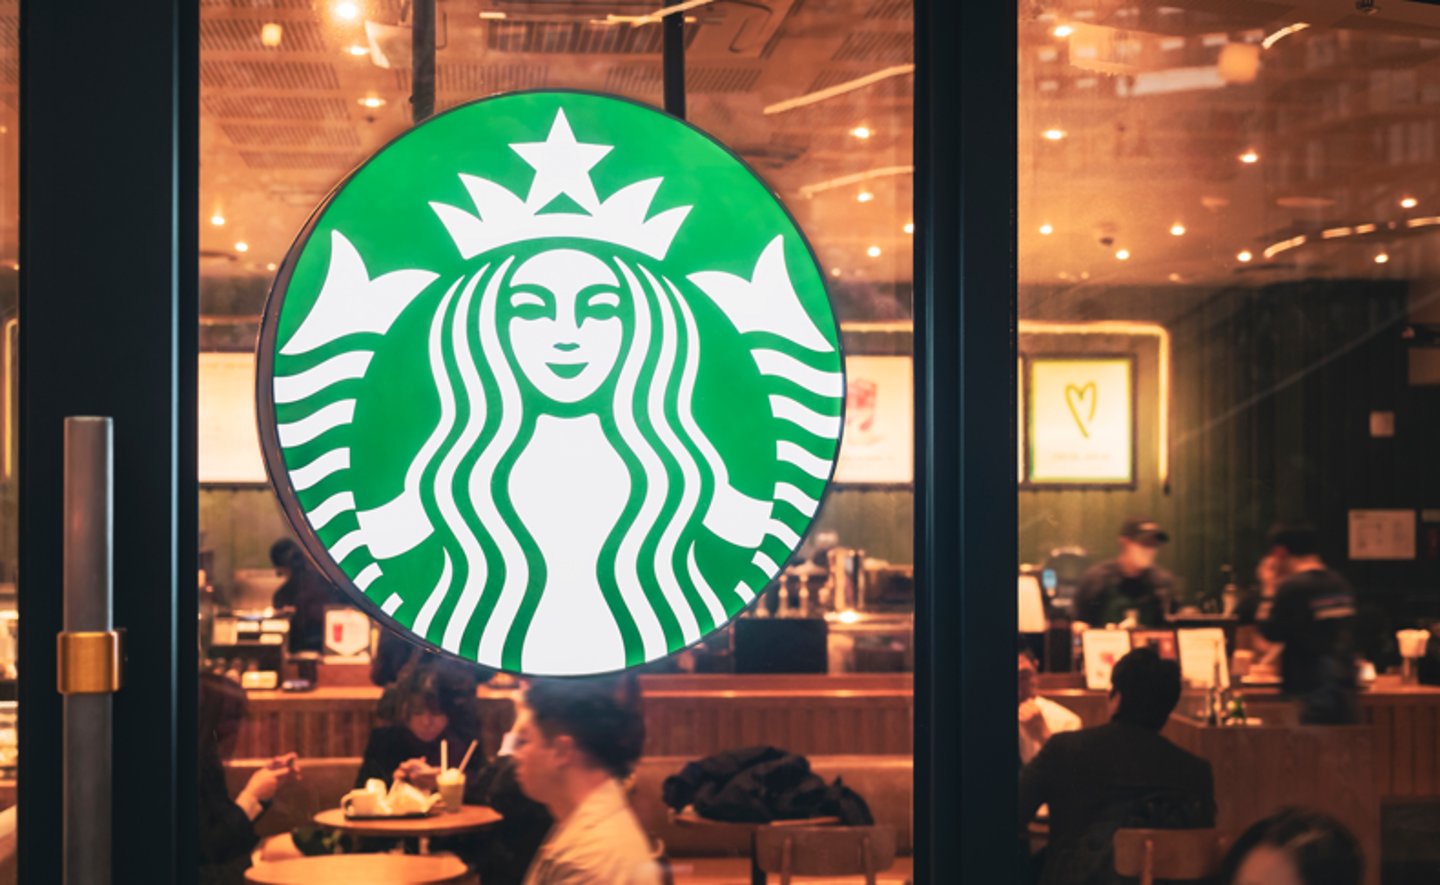
It's a brew-haha: Coffee chains battle for space
Like oil, coffee is one of the world's most traded substances, with around 2.5 billion cups of the stuff consumed daily. Roughly 60% of the American population drinks coffee every day, and there are nearly 40,000 Starbucks stores worldwide, including almost 18,000 in North America alone.
Hundreds of operators are fighting for market share in the coffee space, making it a highly competitive and compressed industry. The coffee shop franchising subsector remains particularly buoyant, with at least 44% of coffee drinkers getting takeaway coffee from franchise cafés several times a week. That said, corporate coffee chain sales grew 10% from June 2021 to June 2022, nearing pre-pandemic levels.
In recent years, private equity and venture capital have driven the sector, providing plenty of opportunities for growth and returns. You'll often see a story about a coffee company receiving millions of dollars of funding, with investors hoping to buy up — and extract wealth from — shiny new startups.
Starbucks remains the industry leader with $27.5 billion in sales, followed by Dunkin' at $11.2 billion. In total, there are 29 national players — a mixture of big-name national coffee chains and smaller regional businesses.
Starbucks plans to open 17,000 new stores globally by 2030. The company is focusing on international markets and achieving a 4% annual growth rate in the U.S. market. Regional chains like Caribou Coffee and Scooter's Coffee are also growing, with the former adding 159 new stores in 2023 and planning similar growth this year.
Perhaps unsurprisingly, Starbucks maintains a 40% share of the coffee market in terms of number of outlets, with more than 16,000 locations in the U.S. Next is Dunkin’ with some 9,000 locations, Dutch Bros Coffee with over 900 units, and Tim Hortons with approximately 640.
When it comes to the percentage of on-market listings between 2018 and 2024, Starbucks also reigns supreme, with 55%. Up next are Dutch Bros Coffee (15%), 7 Brew Coffee (12%), Scooter's Coffee (7%) and Dunkin' (3%). Other brands make up 8% of on-market listings.
On-Market Listings and Sales. But which brands actually sell? Shipley's Do-Nuts and The Coffee Bean & Tea Leaf have the highest success rates for the number of units sold compared to units listed (80%) between 2018 and 2024, followed by Krispy Kreme (62%) and Black Rock Coffee Bar (61%). Dutch Bros Coffee and Starbucks have success rates of 60% and 51%, respectively. Brands like Biggby Coffee (29%) and Ziggi’s Coffee (25%) that don’t have the footprints or recognizability of some of the larger players rank much lower in terms of their listing success rates.
Cap Rates. Although it depends on the brand, cap rates in the coffee sector have generally fluctuated in the last few years, dipping greatly during COVID and its subsequent inflationary period before rising above pre-COVID levels in 2024. For example, Starbucks had an average cap rate of 5.32% in 2019, 5.05% in 2020 when the pandemic hit, 4.84% in 2021, 4.78% in 2022, 5.29% in 2023, and 5.60% in 2024. Other brands, including Dutch Bros, followed similar trajectories, with average cap rates falling downward during COVID and inflation and then generally increasing again in 2022 and 2023.
Rents. Rents in the coffee sector have followed a similar course to cap rates — sometimes dropping, or at least plateauing. Starbucks’ average rent went from $130,940 in 2019 before decreasing to $120,748 in 2020 — a drop of about 8%. Average rent ticked up to $129,006 in 2021, dropped again to $126,419 in 2022, and increased to $134,481 in 2023.
Generally, Starbucks commands the highest rents of any chain. Its average rent of $145,593 in 2024 is more than 40% higher than No. 2 Dunkin's average rent of $86,381 this year.
Starbucks also maintains larger properties than many other national chains. Its average rentable square footage of 2,411 compares to less than 1,000 sq. ft. for Scooters and Dutch Bros. Higher construction costs translate to higher rent, which can impact Starbucks; ability to sell if the market interprets the rent to be unsustainable.
The newer brands are certainly making their mark and resonating with consumers. Dutch Bros, for example, achieved a tremendous 39% year-on-year sales growth in the first quarter of this year, with future growth expected.
Some of these companies will undoubtedly continue to skyrocket as they build brand loyalty with consumers, while growth for other brands may stabilize. Other chains, however, won’t be as successful and may fade into obscurity as competition across this sector remains fierce.
Matt Lipson and Mike Philbin are co-founders of the Northmarq Restaurant Group.


